Schematic 3D Integrator
User Guide
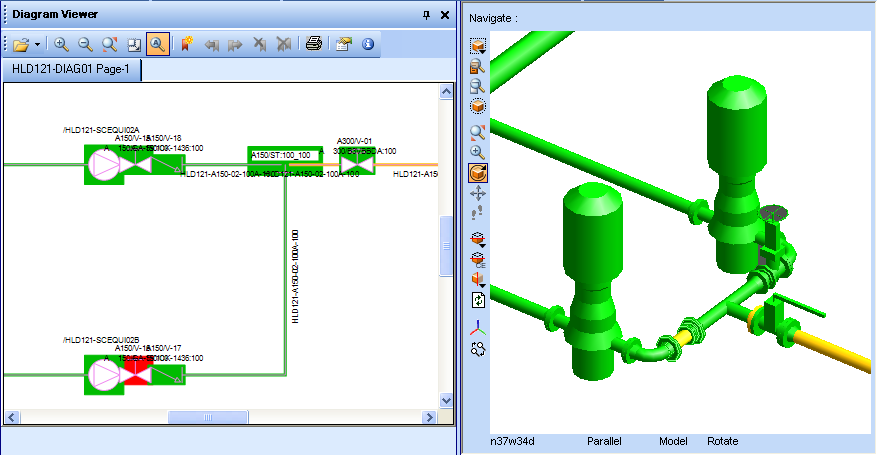
Integrator Functions in Detail
:
How Integrator Compares Schematic and 3D Data
: Example Compare Colour Coded Diagram and 3D View
Example Compare Colour Coded Diagram and 3D View
An example comparing a pipeline is shown below.
Integrator has coloured the diagram and 3D views to show:
•
Red for components present in one view but missing from the other view
•
Yellow for warnings or information
•
Orange for components with some mismatch in attribute values
•
Green for components that match
Figure 5:4.
Compare Pipeline Coloured Diagram
Integrator has created a separate 3D view for the compare results. This view has its own drawlist so that results of the colour coding do not affect any other views that the user may have defined.
Note:
If you cannot see the Integrator 3D View, use the
Window
menu to pop it to the front.
1974 to current year.
AVEVA Solutions Limited and its subsidiaries. All rights reserved.